
Business is dependent on various calculations and varying factors that change over time. It has always been dependent on these things but now, we have created various tools and parameters for those tools that let us calculate our progress.
These tools and parameters are precious for your business because they let you find out details about your work and go in-depth to find out your shortcomings. One of these valuable elements is the S-Curve graph which finds out some of the most important details about your business.
Let’s take a look.
What Is a S-Curve in Project Management
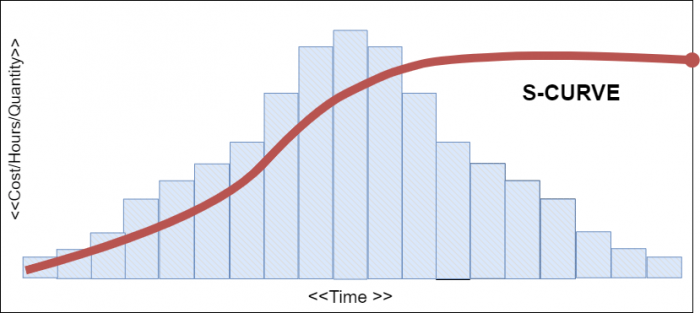
In project management, an s-curve is a mathematical graph or illustration that properly illustrates the appropriate cumulative data for a project or task. This data can be the cost or man-hours plotted against time.
The reason why it’s called an S curve is not a very technical one. It’s because of the S-shape that the graph makes. You show know that this shape of the graph depends on the genre of project you are working on, so many formations apart from this one are also possible.
The s-curve in project management terms is a graph to effectively track the progress of the project you are working on. This comes in very handy because, in today’s fast-paced business culture, ensuring that the appointed budget is being spent according to schedule to fulfill all of the needs and requirements of the project.
Why an ‘S’?
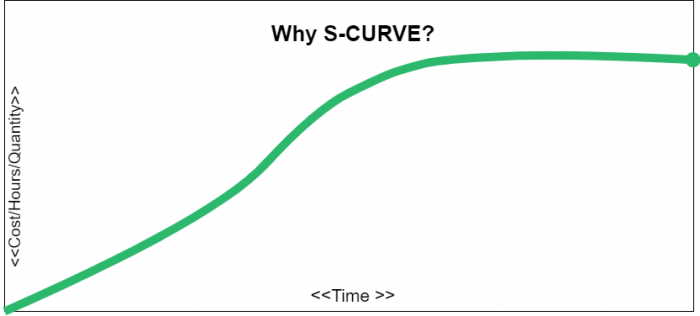
Well, the ‘S’ shape is nothing forced or developed. It’s just the shape that the graph makes during the early stages of the project when the standard growth of the project is very slow.
During the early stages, the project is starting to unravel, and the team members are just doing research about the industry, or they are just beginning to engage in the first phase of project execution.
This process can take longer at first, but when the team gets the hang of it, they quickly work out the kinks, and the process becomes seamless as the processes trod along.
As more and more progress is made, the growth suddenly starts to speed up. If you want to see this rapid growth in the graph, it will be the middle part of the ‘s.’ The point which exhibits the maximum growth is called the point of inflection. These are the most important parts of the curve because this is the place where growth stagnates.
At this time in the process, the team members are generally working quite heavily on the project tasks, and as they ramp up this process, more and more tasks surface, and so do their costs.
After passing the point of inflection, the growth plateaus and forms the upper part of the s-curve. This part is called the upper asymptote. Basically, this is the mature phase of the project.
This maturity is because of the fact that most projects are finished at this point and are in the process of winding down. Generally, when the process reaches this point, only the tasks such as finishing touches and the last stage approvals are unfinished.
Types of S-curves
A wide variety of s-curves can be used in the project management application. These are as follows:
- Target S-curve
- Costs versus Time S-curve
- Value and Percentage S-curves
- Baseline S-curve
- Man-Hours versus Time S-curve
- Actual S-curve
What are the common uses of the s curve in project management?
S-curves are useful for many different purposes throughout the project lifespan. Some of the most important uses of s-curves are discussed below:
1. Performance and Progress Evaluation
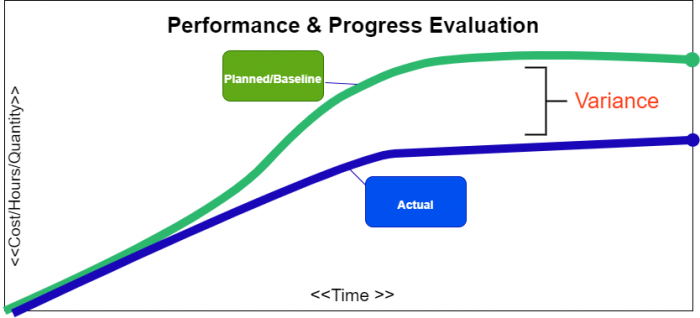
First and foremost, S-curves are used in evaluating the progress of the project in question and its performance. This is achieved through the use of Earned Value Management.
S-Curve graphs are traditionally generated as a part of the EVMS process and are the basic building block of the evaluation of the project’s progress and performance.
A lot of factors need to be evaluated in the process of finding out the current status of the project and future forecasts about the project. They are:
- Performance Measurement Baseline (PMB), which is also known as Planned Value
- Earned Value
- Actual Cost
All of these factors need to be compared with the planned S-curve to generate results.
This comparison is compelling because if you want to know if the project is overrunning the budget or some other task is behind schedule, you can glance at the graph, and it will immediately answer your query.
2. Cash Flow Forecasts
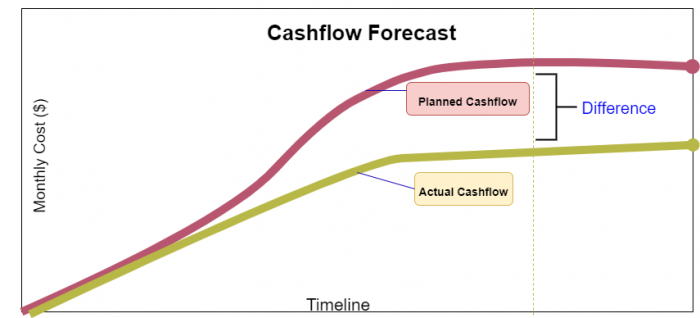
The next use of s-curves is the development of Cash flow and forecasting the changes that the cash flow would bring.
What is that?
Cash Flow is the timing and movement of the cash with respect to the tasks and events happening during the project execution.
This cash flow curve is handy for the stakeholders. The most important benefit of drawing a cash flow curve is that you can evaluate the need for cash and the actual timing when the payment is due under the obligations accepted by the company.
3. Quantity Output Comparison
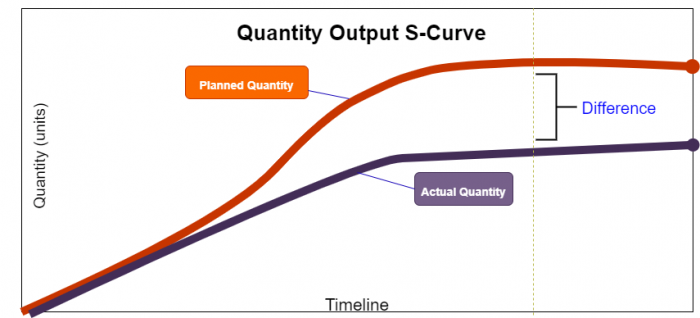
Another important use of s curves is to evaluate the quantity output that your project will yield. This is used more prominently in the construction and manufacturing industries.
4. Schedule Range of Possibilities, a.k.a. Banana Curves
This is probably the most important use of s-curves. As we know, most scheduling software can easily drum up s-curves from schedulers using parameters like
- Quality
- Man-hours
- Cost
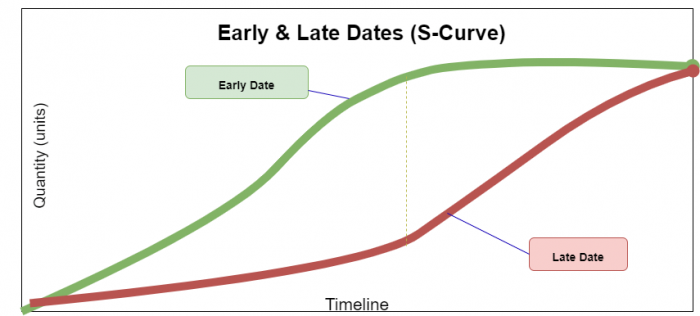
The banana shape curve tells us the range of possibilities when we can expect the project to be completed on time.
This software can provide us with the following types of s-curves.
- One type can be generated according to the early dates
- The second type of s-curve can be generated according to the late dates
These two types of s-curves generally overlap at the very start and end of the project. The shape they form is like a banana, hence the name, Banana Curves.
Conclusion
Project management is a very tricky business nowadays, and many factors need to be monitored if you want your business to be successful. These factors need proper tools and parameters to be explored, and the s-curve is just that.
It is an incredible tool at our disposal that can help us monitor our costs concerning all of the man-hours and other factors.
So, if you want your business or project management activities to be successful, use s-curve to dive in and drive all of the kinks out.
More Readings:


