A Gantt chart may seem simple, but it is a crucial tool in a project manager’s toolbox and provides valuable information pertaining to everything from what a resource is working on to how a project is progressing and everything in before, after, and in between.
But with something that is so vital to the project management process you want to ensure that you make the perfect Gantt chart that can help you and your team to the utmost.
It is the role that Gantt charts play in the lifecycle of a project that prompted us to write this post on how to make a Gantt chart and work you through the steps of how to create a Gantt chart as well as show you what nTask can offer.
So, without further ado, here is our guide on how to make a Gantt chart and everything you need to know to get you and your team started.
What is a Gantt chart?
We have a load of material on all things Gantt charts on our blog from the benefits of using Gantt charts to the difference between Gantt charts and PERT charts but before we can start how to create a Gantt chart let’s refresh what a Gantt chart actually is.
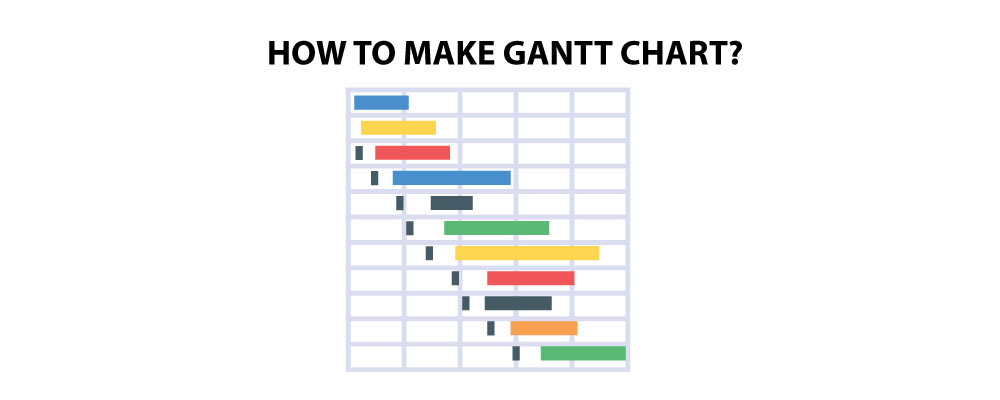
A Gantt chart has been defined in various ways depending on who you ask. In its most basic form, however, a Gantt chart is most commonly seen as a bar chart that plots the scope of work in a project against a timeline.
Let’s break this down.
A Gantt chart is a visual representation of the tasks, milestones, and deliverables that make up your project against time or project schedule. Therefore, the Gantt chart illustrates a clear relationship between the work in your project and time.
Time is illustrated on the x-axis of a Gantt chart while the work, tasks, deliverables, milestones, etc are illustrated on the y-axis.
So, what exactly does a Gantt chart highlight?
A Gantt chart helps project managers and teams gain a visual overview of the following elements of a project:
- The project’s scheduled tasks
- The duration of tasks including start and end dates for each task
- Milestones in a project that indicate any key events in the project’s lifecycle
- Any dependencies between tasks or if tasks overlap
- The roadmap of your project
- The overview of your project’s progress
While Gantt charts were historically created by hand these posed many difficulties including the inability of changes in the project such as the project’s progress to be automatically updated.
With the invention of project management tools, the Gantt chart game has drastically changed and now there are a variety of different project management tools that offer the Gantt chart for you and your team with different capabilities and functionalities.
Steps To Make Gantt Charts
- Construct a mental project or activity: It can be difficult to evaluate the completion time of tasks.
- Assess the current project plan: To get a clear image of who needs to be involved, you should review each phase, from planning through implementation. This information will be used to determine timelines.
- Determine which tasks are interconnected: Certain tasks can be conducted concurrently. This will help you realize how much time each step takes and when the steps should take place.
- Use your task time periods to create a Gantt chart: Here is where software can help. It allows you to enter start and finish activities and then automatically creates a Gantt chart that you can share with your team to see how long each project will take. Milestones are extremely complicated and should be broken down into sub-milestones during this step.
- Provide any additional details: It is usually a good idea to provide information that will help users understand each component of the project. Some software solutions allow you to do this by generating detail pages for each component, which can then be included in the report and browsed as needed.
- Separate your budget: When you have set a budget, you should have a better idea of whether you will complete it ahead of time or behind schedule.
- Distribute accountability: Each project component should have its own owner. People are more likely to complete a task on schedule and with the appropriate quality when they take ownership or responsibility for it. If there are many contributors, include their names on the Gantt chart as contributors.
- Save your Gantt chart for future reference: As time passes and you proceed through your project, you should refer to your Gantt chart as often as feasible. It will allow you to assess the various components and determine what those statuses mean for project completion.
Why is nTask’s Gantt chart Different?
There are many project management tools available for teams nowadays with most offering Gantt chart functionality, so what makes nTask’s Gantt chart different?
nTask is a project management tool that is an all-in-one yet versatile platform that offers its users the ability to manage projects, teams, and clients with ease.
The software provides all the features needed for teams to streamline the entire project management lifecycle from project initiation all the way to project close.
nTask’s Gantt chart is also different from its competitors due to its adaptive and dynamic nature.
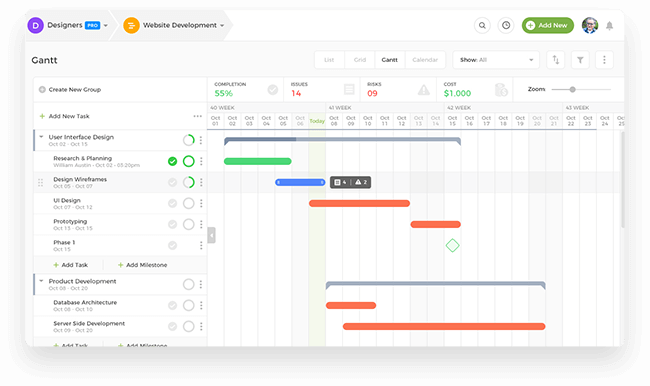
Besides the basic visual aid that basic Gantt charts offer, nTask’s Gantt chart provides a more comprehensive view of the entire project. You can see which resources are working on each task as well as other task details such as priority and checklist items if you clock on the taskbars.
Apart from details about the task, nTask’s Gantt chart is color coded. Depending on the status you give each task you can see how your project is progressing with a simple view. You can create custom statuses or use the in-built statuses provided.
With nTask you have orange for ‘not started’, blue for ‘in progress’, yellow for ‘in review’, green for ‘completed’, and red for ‘canceled.’
Apart from seeing the progress of your project through the colored bars, you can also track the progress through the progress meter.
nTask’s Gantt chart indicates how each task is progressing with a progress meter as well as how your overall project is progressing with a percentage of how much of the project is complete at the top of the chart.
Other information that is provided in nTask’s Gantt chart that sets it apart from the rest is the simplicity of creating task dependencies.
You can create different task dependencies including:
- Start to start
- End to end
- Start to end
- And end to start
The Gantt charts in nTask are great if you are looking to combine your team’s efforts and collaborate. With in-built communication features and meeting management tools, your team can easily discuss the project and make changes in real-time if the need be.
If you change any task deadlines or durations or edit billable hours the Gantt chart will update those changes automatically.
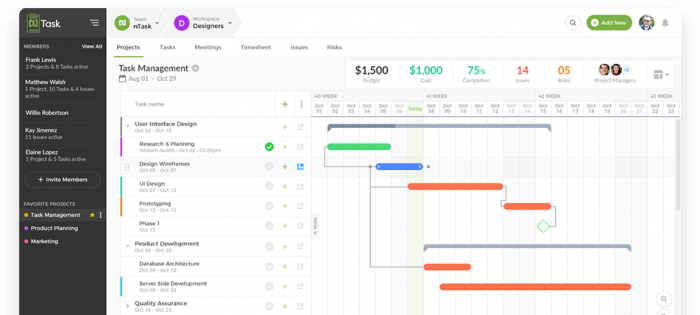
Besides the details about the tasks and the project’s progress, nTask’s Gantt chart also highlights the project’s budget and the cost that has been incurred so far.
The Gantt chart syncs with the timesheets feature and the creation of billable and non-billable hours to show you the project’s cost as it is logged.
nTask’s Gantt chart also allows you and your team to analyze and adapt with ease. The Gantt chart is comprehensive and can highlight the planned schedule against the way the project is actually progressing. You can also view the critical path and milestones.
How to Make a Gantt Chart with nTask?
So, the question is how to make a Gantt chart with nTask?
The answer is that you don’t.
The great thing about nTask’s Gantt chart is that you don’t have to do the work of creating it and it does so automatically.
All you and your team need to do is plan your project and create tasks that will automatically be converted into a Gantt chart and also update depending on any changes.
Let’s dive in and see how.
The first step to making nTask’s Gantt chart is creating a project. nTask offers the ability to create unlimited workspaces, projects, and tasks.
Once you create a project you need to create tasks and fill in the relevant details to display your Gantt chart and see a visual representation of your project and tasks.
For each task, you need to set a start and end date to see it displayed on the Gantt chart. You have the option to add planned dates or alternatively to fill in the actual dates the task started and ended.
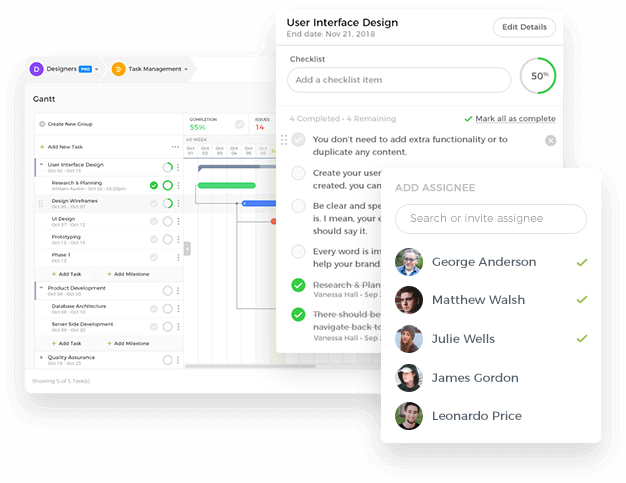
Apart from the start and end dates of a task you also can add task details, assign the task to team members, set a task priority, and more. However, you only need to create a task and set dates in order for the task to be displayed on the Gantt chart.
These tasks will be displayed as bars on the Gantt chart.
Once your team starts working on the tasks and updating their status the bars on the Gantt chart will change color to corroborate with the status of the task.
You can easily change the dates of tasks by dragging and dropping the bars according to the new dates or expanding the bar to increase the duration of the task.
The checklist items that you create for each task and the progress of those to-do list items will be indicated as a percentage on each bar as well as a progress meter at the top of the Gantt chart.
You can also create milestones which will be displayed with a diamond icon on the Gantt chart.
For task dependencies, you simply need to connect the tasks either from start to start, start to end, end to end, or end to start depending on the type of dependency.
For more details as to how to create a Gantt chart using nTask, you can contact the sales team for an in-detail demo where a sales representative will walk you through the application and show you how you can use the platform for your team.
Alternatively, you can check out the support articles on the website here.
Robust Planninng Using
nTask Gantt Charts!
Gantt Chart Features of nTask
nTask is a powerful and user-friendly Gantt chart program that assists you in more successfully managing your projects. It has all of the features you need to maintain a realistic and exact track of your timetable, projects, and resources. It also makes it easier to create spectacular timelines that are both intuitive and instructional.
The first step in creating a Gantt chart is to include a project. Your project will require a unique ID and a project title. Users can add a task with the title of the task or create a milestone with the title, planned date, and description of the milestone. When you create a nTask Gantt chart, you can make it as specific as you want. You can provide a task description, a to-do list, and the task’s priority status.
One of the major features of nTask is the ability to measure your progress by defining planned and actual start and completion dates. This allows you to keep track of deadlines and assess whether you met them or not.
The findings also represent your productivity and efficiency in completing tasks. After that, you can start allocating tasks to available resources. You can choose an assignee from your team or input the email address of a new assignee.
You may also provide task status to track how a project is developing. nTask has five different ways to determine the status of the task. All of the options are also color-coded to make it easier to discern the condition at a glance:
- Not started (orange)
- In progress (blue)
- In-review (yellow)
- Completed (green)
- Canceled (red)
The Gantt chart created displays the project overview, containing data such as the project budget, project cost, completion %, problems, risks, and the project manager, allowing you to see all the facts at a glance.
Another of the most important features that nTask provides to make Gantt charts is its flexibility. You can shift bars and adjust the current and planned dates with a simple drag-and-drop. You can also slide the bars to increase the time it takes to complete a task.
In Conclusion
So, do you now know how to make a Gantt chart?
Create your next project’s Gantt chart the easy way with nTask’s comprehensive Gantt chart feature and streamline your entire project management process with the intuitive and easy-to-use platform.
nTask’s Gantt chart takes away the unnecessary hassle and gives you and your team the freedom to focus on the work at hand.
The tool not only simplifies the process of creating a Gantt chart but also provides a Gantt chart that is interactive, dynamic, and overall better than if you were to make one on Gantt chart either Excel, PowerPoint or through pen and paper.
And that is how to make a Gantt chart the right way.


