There are many tools and techniques that come together to help teams deliver successful projects. One such popular tool, the Gantt chart timeline, was updated and reintroduced by Henry Gantt and is used by project managers and project teams across the world.
The Gantt chart timeline not only provides help to teams during the project’s execution but offers capabilities during the planning and the project close phases as well.
Here is everything you need to know about Gantt chart timelines and which Gantt chart timeline software can offer your team the most.
What is a Gantt Chart Timeline?
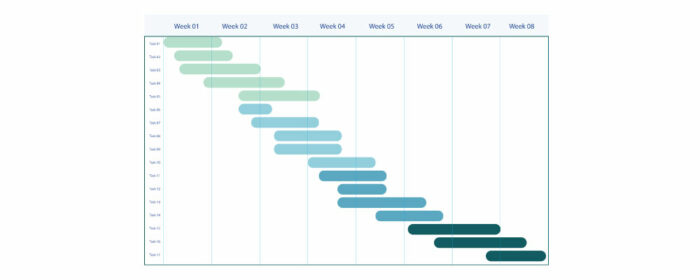
Depending on who you ask, a Gantt chart timeline can be characterized in a variety of ways. However, a Gantt chart is most typically viewed as a bar chart that depicts the scope of work in a project against a timetable.
In other words, you can understand a Gantt chart as a visual depiction of your project elements including project deliverables, project activities, and different milestones all in relation to the project’s timeline.
The Gantt chart, therefore, is a depiction of the link between the effort put into the project against the time spent on the project.
The x-axis of a Gantt chart represents time, while the y-axis of the Gantt chart represents work, tasks, deliverables, milestones, etc.
Importance of a Gantt Chart Timeline in Project Management
The Gantt Chart has gained popularity in the project management world as a powerful and sometimes even vital tool for teams to simplify and streamline the project management process.
The Gantt chart is an analytical tool that offers teams and other relevant individuals such as stakeholders and clients a complete overview or birds-eye view of the project in its entirety.
The Gantt chart holds an important place in project management for multiple different reasons. And here is why:
The way a team uses the Gantt chart determines how important the tool is for that particular project. Here are just some of the reasons a project can be imperative to so many projects.
Provides a Means to Visualize the Progress of Your Project
Gantt charts are comprehensive graphical representations of your project. This tool, therefore, allows you and your team to gain a visual perspective of how your project is progressing.
The Gantt chart provides a complete picture of the project with all information related to understanding the current status of the project in a centralized graph which is both detailed in nature yet easy to understand at a glance.
Identifies and Maps Out Any Task Dependencies in Your Project
In a project, not all tasks are clear-cut and individual. Much like tasks that you perform on a day-to-day basis. There are certain tasks that are dependent on the completion or start of another task.
As a team working on a project, it is important to understand these task dependencies in order to be able to work on the project effectively and reach a successful project close.
The Gantt chart maps not only the tasks of a project but also any connection between them in the form of task dependencies.
Your team will therefore be able to visually see how their work will impact the work of other team members, both helping teams are motivated to work on their tasks efficiently and also helping team members collaborate with their peers.
Highlights a Project’s Schedule
As we will discuss below there are many similarities between a project timeline, a project calendar, and a project Gantt chart.
The main similarity between all three is that they all display a project’s schedule.
With Gantt charts, you can easily view the project’s schedule and view other information regarding the project’s timeline. Such information is critical to help your team reach the decided project deadline.
Difference Between Gantt Chart Timeline and Basic Timeline in Project Management
Very often Gantt charts and timelines are confused for each other. However, due to the different nature and the different capabilities that both provide this should be avoided.
Both Gantt charts and timelines are visual charts the two display the project’s schedule and timeframe in different manners and are used in different ways.
A project timeline displays project events in chronological order. The project timeline is a simpler view of a Gantt chart displaying tasks, their start and end dates, and task durations.
If teams are looking for a simple outline of what the project schedule will look like, a project roadmap or project timeline is the way to go.
Project timelines miss out on other key elements that Gantt charts provide, however. Gantt charts provide a view of project progress, highlight task dependencies, and more.
A Gantt chart can be used to get a thorough picture of how your project is doing and if there are any things that need to be adjusted. The tool offers a microscopic perspective of different details of your project including current task progress, milestones, task priorities, and estimates of time.
A timeline on the other hand provides a rapid visual representation of information such as task titles, durations, and assignees. Timelines are commonly used to illustrate the project’s timetable, upcoming events, and tasks that have been accomplished.
Difference Between Gantt Chart Timeline and Calendar in Project Management
A calendar view or calendar in the project management world can be differentiated from both Gantt charts and timelines.
Calendars are the most minimalistic form of viewing the project schedule and getting an overview.
While calendars do offer the ability to see how your project tasks are scheduled across a timeframe, they lack other details that are key to getting a proper understanding of how your project is progressing.
Calendars lack details such as task dependencies, task priorities, task assignees, product roadmap, etc.
However, this is not to say that the project calendar does not have its own importance and role to play in the project management process.
A calendar is a perfect tool if you are looking to gain a quick view of essential dates to your project.
You can get an overview of how tasks are spread over the project’s timeframe.
nTask acknowledges that at times a simple view of tasks on a calendar is the easiest means by which certain information can be relayed to stakeholders or clients, or even just to gain a quick perspective of the project schedule.
Therefore, nTask’s platform comes equipped with the option to view tasks in a calendar view on the task page.
Users can choose which view will be most effective for them with a choice between a list, grid, or calendar view.
Featured Resources:
Elements of a Gantt Chart Timeline
Depending on the Gantt chart timeline software you use, you can gain access to different elements.
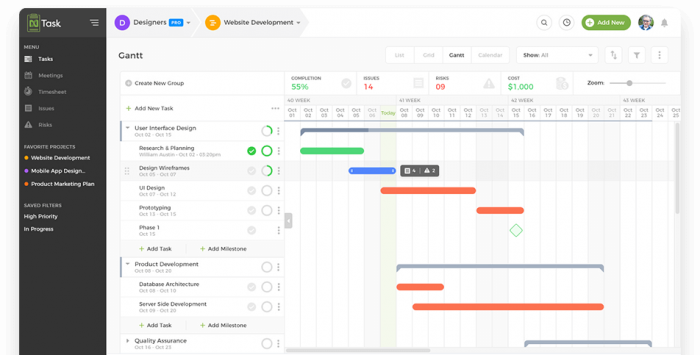
Let’s look at the elements that are available in nTask’s Gantt chart.
1. Projects and Tasks
In nTask you can create multiple projects. Each project allows you to define tasks that are required to accomplish it.
nTask will automatically build an interactive Gantt chart for you when you create these tasks and fill in all the required information.
nTask provides a distinct Gantt chart for each project, ensuring that your projects and tasks are not mixed up and that everything is plain and transparent for you, your team, and any other relevant persons with portal access.
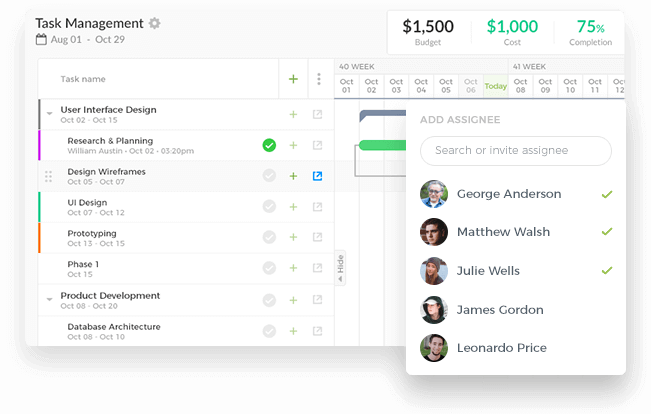
2. Project Summaries
With its interactive interface, nTask’s Gantt chart gives an overview of your project’s current status.
nTask provides a comprehensive overview of all the aspects and actions that occurred during the project.
This element can be used by teams during the entirety of the project and even after you have finished the project. This element can be used to assess what worked and where your company needs to improve for future jobs.
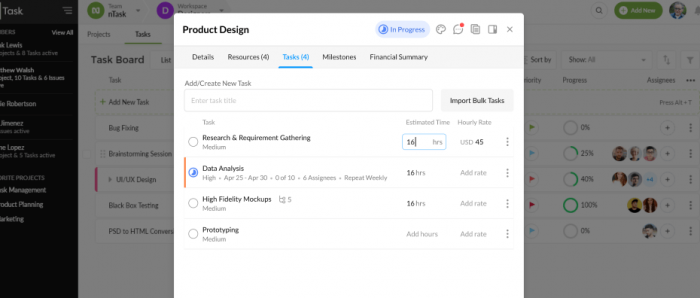
3. Task Assignees
When you create a task, you can assign the task to one or more individuals in your team. These are those resources that are in charge of completing the tasks.
You may give tasks to resources directly from the Gantt chart or you can go through the task board instead.
nTask is an excellent project planning tool since it allows you to design your full project plan and specify tasks and deadlines before assigning individual tasks to team members.
4. Task Start and End Dates
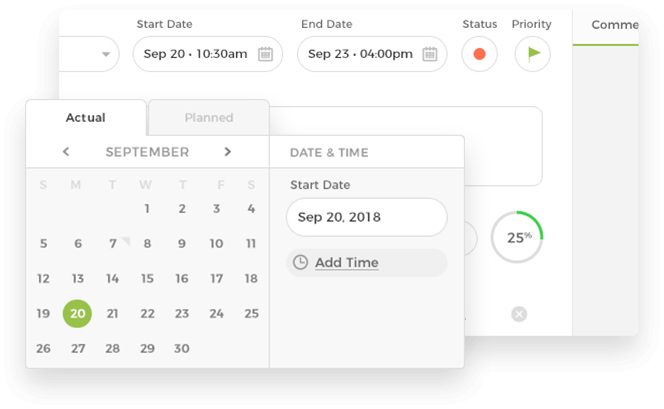
When you plan projects in nTask you can create tasks. You can add details regarding that task including task start and end dates.
The start and end dates you include for each task are important to allow the platform to create your Gantt chart.
nTask offers the option to track your tasks’ planned dates as well as your actual dates. You can choose which way you wish to view your Gantt chart. The bars can either depict the planned dates, or the actual dates. You can even choose to view a comparison between the two.
5. Task Status and Task Priorities
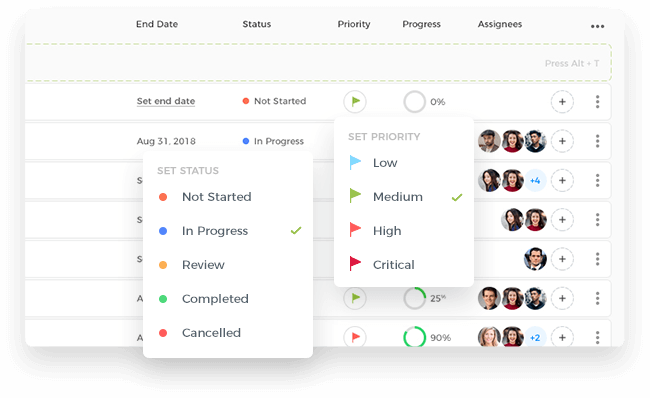
The color of each taskbar on your nTask Gantt chart is determined by the assigned job status. Task statuses include ‘not started’ as orange, ‘in progress’ as blue, ‘in review’ as yellow, ‘completed’ as green, and ‘canceled’ as red.
You can also choose to create custom statuses with nTask’s new update.
The task status, as well as the completion percentage, will be used by you and your team to keep track of your project’s progress at all times.
6. Checklists
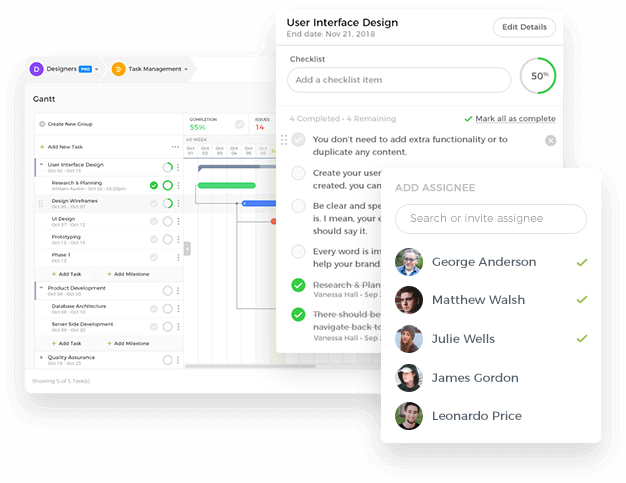
Checklists are the actions or to-do list items that must be completed in order to perform specific tasks.
With checklists, nTask allows you to develop the most thorough plan imaginable. It can also guarantee that your team members are aware of exactly what has to be done and have access to a centralized platform to seek clarification if needed.
These checklists serve as the different tasks’ progress meter. The bar showing the task will reflect what percentage is complete once your team member ticks off items on their task’s checklist.
7. Task Dependencies
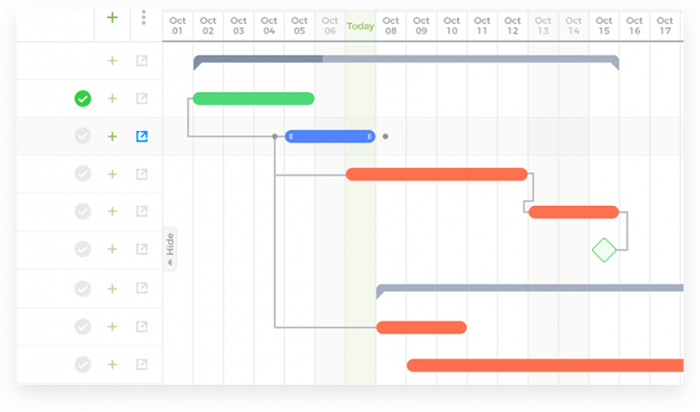
The Gantt chart in nTask allows you to establish task dependencies.
These depict the relationship between the tasks or tasks and milestones. Different task dependencies can be created. The possible task dependencies include:
- Start to start
- Start to end
- End to end
- End to start
These dependencies will appear as lines linking distinct tasks or tasks and milestones on the chart.
8. Project Milestones
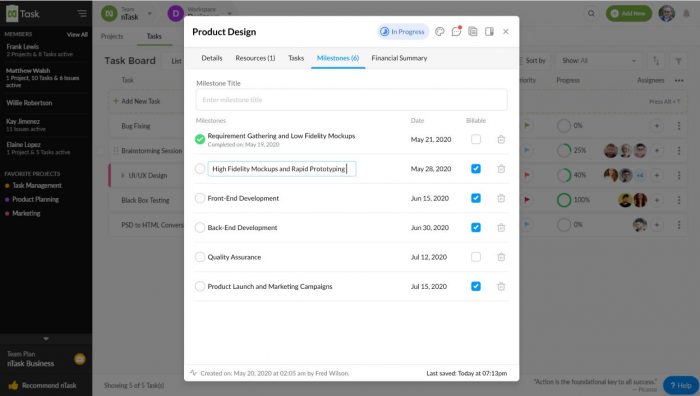
Project milestones are the element is a Gantt chart that shows crucial milestones or stages of a project which are in addition to tasks.
These milestones are shown on nTask’s Gantt charts as little diamond-shaped icons.
Within nTask’s projects and tasks, you may define a variety of milestones. These milestones as well as tasks you have defined can be used to track the progress of your project.
These crucial places in your project may be seen using the same interface.
9. Project Cost
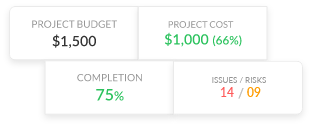
The Gantt chart in nTask provides additional information such as project budget and cost.
With nTask’s comprehensive timesheets module, nTask determines the current cost you have incurred as you begin work and indicates this on the Gantt chart.
nTask is a comprehensive project management solution that combines all the features you will need to a successful project onto a single platform.
The software also allows you to produce timesheets and compute billable and nonbillable hours, these are immediately translated onto the Gantt chart.
Gantt chart vs. Kanban
As we have discussed earlier, the importance of Gantt charts and how they can make your life easier while creating and managing tasks in a more visually appealing way.
So why would you ever want any other version of that?
Well, as it turns out, the other version is no slouch either.
The other version we are talking about is the extremely popular task-tracking tool known as Kanban boards.
This tool allows you to present all of the ongoing tasks that you are working on, as part of the project development process, in columns depending on the specific stage of completion they are currently in.
So, which one to choose? The answer to that depends on how your project is set up from the beginning.
Let’s take a look at the situations where you can use Gantt charts or Kanban boards.
Gantt charts:
- Gantt charts are perfect when there are a lot of dependencies in your project, and you want to mark the order in which the tasks are needed to be executed
- They are also useful when the project requires road mapping enabling you and your team to view the entire project in a single interface
- It is also useful to prioritize all of the different tasks
Kanban boards:
- Kanban boards are perfect if you want to have a singular focus and not want to keep an eye on a million things at once, as a manager or a team member
- If you know that your project is going to change at a later stage, then Kanban boards are perfect for you as they are better equipped to envelop change than Gantt charts
When do you use a Gantt Chart Timeline?
A Gantt chart plays an important role in project management and is used throughout the lifecycle of the project from the start of the project and project initiation right till you deliver the project at project close.
Gantt chart timelines are used to both plan and schedule projects as well as plan and schedule individual tasks.
Gantt charts are also used to get an overview of the project and view tasks over time.
Resource management and scheduling teamwork is also made easier with the help of Gantt charts.
Moreover, Gantt charts are also used for team collaboration, and to plan sprits in Agile project management.
Gantt charts are also a tool that allows teas to determine planned dates and actual dates of a timeline in a project.
nTask as Your Gantt Chart Timeline Software
nTask is a versatile platform that offers all the tools teams need to manage the processes associated with running a successful project.
One such tool is the Gantt chart timeline which runs seamlessly to provide teams with the ability to both plan their projects as well as gain insights into the progress of the project throughout the project management lifecycle.
nTask’s Gantt chart timeline module makes creating a Gantt chart so simple it is as if you don’t have to do any work. Which you don’t!
nTask simply requires you to plan your project, create tasks, and input relevant information. The tool then generates the Gantt chart for you and automatically updates it when you input progress or make amendments.
nTask’s Gantt chart timeline is set apart from the rest due to its adaptability and dynamic nature.

-
Interactive PM with nTask Gantt charts.
Create projects, Gantt charts, timelines, workflows and tasks, all in one place. Sign up today!
- Get Started for Free
If you want to integrate your team’s work and cooperate, nTask’s Gantt charts are ideal. Your team can quickly discuss the project and make modifications in real-time if necessary thanks to built-in communication capabilities and meeting management tools.
Find out more about nTask’s features and how your team can use the tool by booking a demo with one of our sales representatives today!


