Fortunately, you’ve come to the right place if to learn all about Gantt chart dependencies in nTask as well as some quick tips on how to boost up your processes while using nTask Gantt chart.
But wait! Hold on!
Do you know what Gantt charts are used for after all?
Gantt charts are used to show a visual timeline of all tasks in a pictorial form. It is one of the most important features in any project management app. However, to get the full benefit from it, you need to utilize its functions fully.
For example, how to create Gantt chart dependencies?
Here is a quick guide that you can follow to create Gantt chart dependencies in nTask!
Follow the steps and create dependencies in nTask in just a few clicks.
What are task dependencies?
When tasks are supposed to get completed in a certain order dependency is created between them. A dependency links one task to another to create a smooth flow. Thus, one task’s result is dependent on the other. Firms create dependencies to schedule and timeline all the tasks effectively.
Creating task dependencies encompasses a lot of benefits. For example:
- Brings out a clear roadmap
- Avoidance of unnecessary actions
- Saves time and wastage of resources
- Lesser chances of errors
- Increased transparency
- Maintaining deadlines
- Effective scheduling
- Risk management
Thus, task dependencies help to boost up communication between teams and stay on track.
Anyway, who doesn’t like to have an organized team and a well-planned project execution roadmap?
In project management, you can create four types of dependencies and each dependency bears a specific function.
Let’s have a look!
Types of dependencies
Let’s assume activity A and activity B as two tasks you ought to create the dependencies with.
- Start to Start: In this relationship, activity A can’t start until activity B has started.
- Start to End: In this relationship, activity B can’t end until the activity has A has started.
- End to Start: In this relationship, activity B can’t start until activity A has been finished.
- End to End: In this relationship, activity A can’t end until activity B has ended
How does it work?
Are you ready?
Let’s start from the beginning to understand how to create Gantt chart dependencies completely.
However, let’s see how to create a Gantt chart first. if you know it already then just jump onto the next heading.
Before setting dependencies
Gantt chart will give you a clear and colorful visualization of all tasks. So, to begin with, that just follow the steps mentioned below and you’ll have your Gantt chart created in just a few steps.
- Start by creating a workspace.
- Once you’ve created an interface, assign tasks by clicking on the task tab on the top bar.
- Assign a name to your task.
Note: You can create dependencies without creating tasks with all the data filled in.
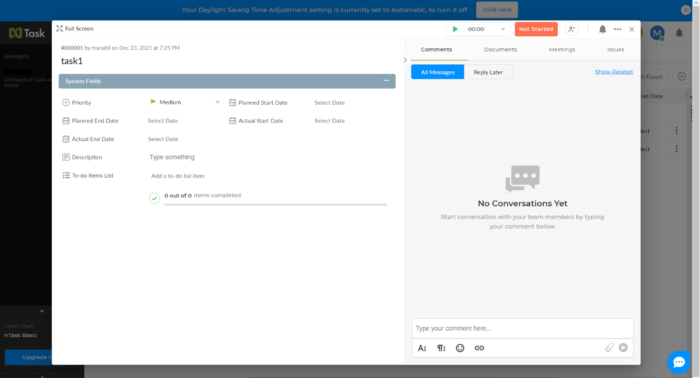
- Double click “the task created” a dialogue box will appear.
- Fill in all the information.
- On the top, you’ll have the priority option. Select “priority” status of it i.e, high, medium, or low.
- Then add a “planned start date” and “end date” for each task.
- Further, add the “actual start” and “end date” for each task.
- Moreover, you can also add a description and a to-do list item for each.
- On the top right corner, the assignee can update their status from not started, in progress, in review, and completed.
How to Set Dependencies in nTask?
Once you’ve added in all the data related to your tasks. It’s time to create your nTask Gantt chart dependencies.
- Firstly, click on Projects on the top bar. Select the project you want to view the Gantt Chart for.
- Move your cursor to the three bars icon next to the project name and click on it to open your nTask Gantt Chart.
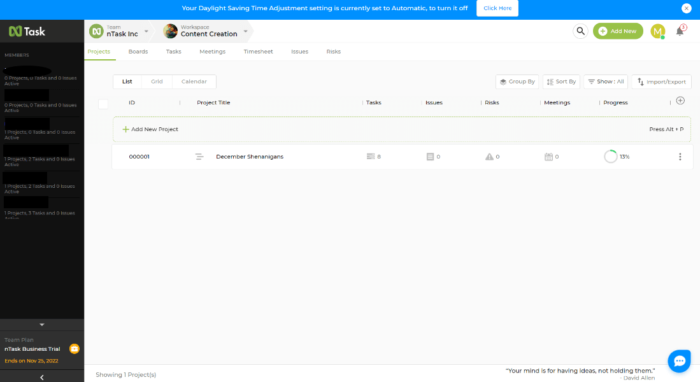
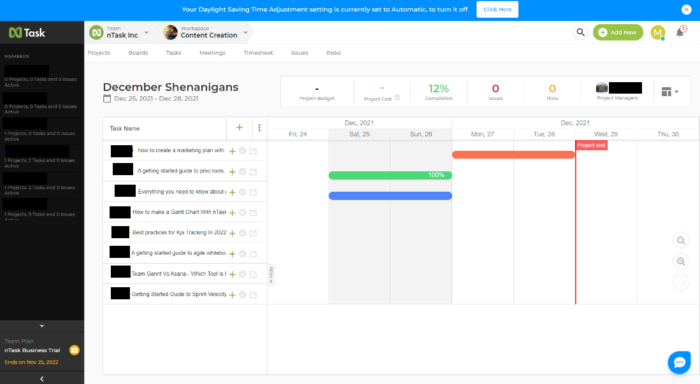
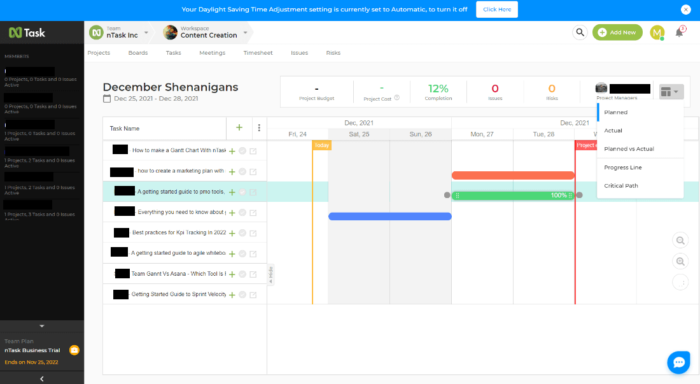
- Once you click you will have the above view. This is what our Gantt chart looks like. On the top, you can see multiple columns indicating project budget, cost, completion percentage, issues, and risks. Then we have the name of the project manager.
- Under that, there are task names along with assignees’ names.
- Click on the + sign to add a subtask.
- Click on the to edit your task.
- Click on one to view the to-do list.
- Moreover, you can see multiple bars indicating the status of each task.
Significance of each bar
- Orange: Task has not been started
- Blue: Task is in progress
- Green: Task has been finished
- Red: Task has been canceled
- Yellow: Task is in review
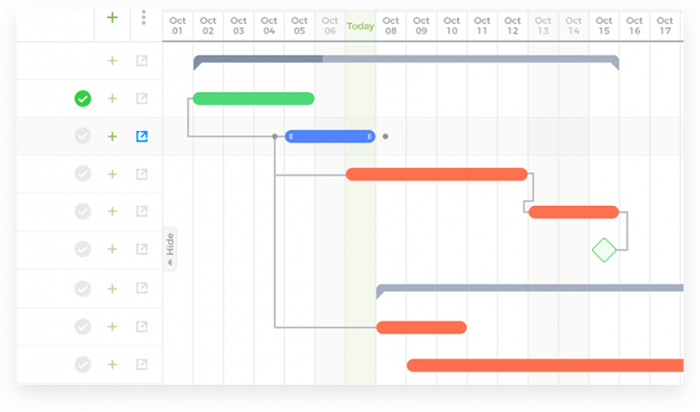
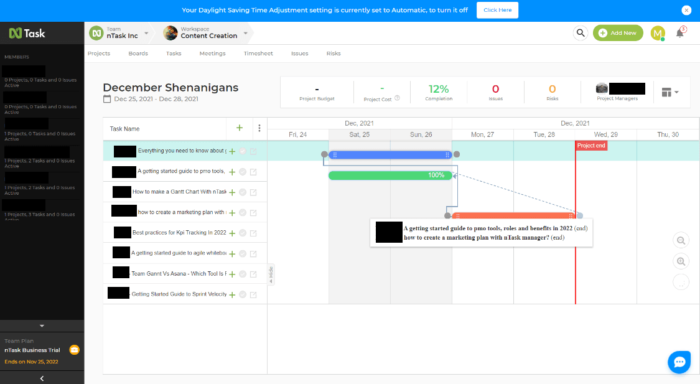
- Create dependency by simply clicking on the grey circle next to each taskbar.
- Join the circle of one task with another to establish a relationship between them. To do that, just click on it and stretch the line to the desired point.
- A small dialogue box will appear, and you’ll be able to see the relationship that is being created.
- Once you’ve connected both ends, Voilà! A dependency is created.
Wasn’t that easy! Fewer processes for better to remember!
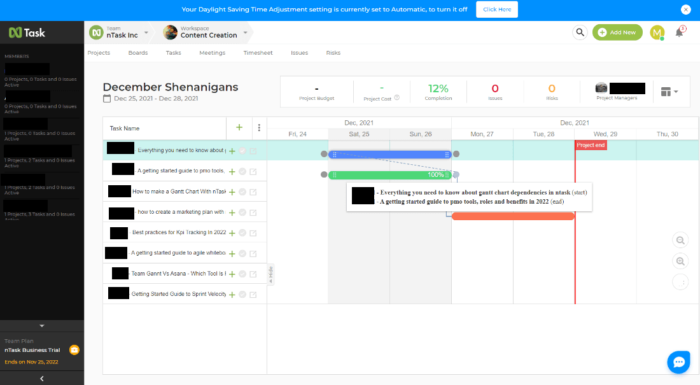
In the following image, we have created an end-to-end dependency between the yellow and orange bars.
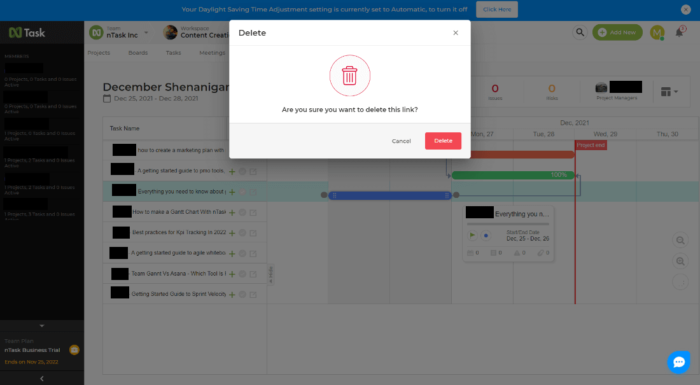
Remove Task Dependency
- Double Click on the black circle next to each bar to remove any dependency.
- You can recreate it by using the same process.
Shortcuts for different visualization options
nTask allows you to view your dependencies in various ways. Just one click and you can view Gantt chart the way you want.
- Navigate your cursor to the three blocks on right.
- Click on it to choose the way you want to view your Gantt chart.
- Planned: It will show all the tasks as per their planned date timeline.
- Actual: It will show the actual set timeline of all the tasks.
- Planned vs Actual: It will show you both timelines simultaneously.
- Progress line: It will give you a pictorial view on how’s the progress of your project coming up.
- Critical Path: It shows the longest sequence of tasks needed to complete a task.
Conclusion
So, here is all that you needed to know about creating nTask Gantt chart dependencies. Thus, synchronize your projects and have a properly planned process.
Creating dependencies in nTask is easy because nTask strives to provide its users with an ultimate user-friendly experience.
Click the links to learn more on nTask dependencies and their importance in project management.
Wish you good luck!


